Zentyal server monitoring with Zabbix
Contents |
Brief
The purpose of this article is to show how to setup monitoring for Zentyal services using the popular open-source monitoring tool “Zabbix”.
This article will guide as through the installation of the monitoring platform and its configuration and customization in order to cover a wide range of the services provided by Zentyal 4.0. As Zabbix is a monitoring tool capable of monitoring many other systems and devices, this can serve as the foundation for a wider monitoring strategy.
We also include templates and scripts used to monitor different services. If you already use Zabbix, you can skip the first section (Installing Zabbix Server).
Difficulty: medium
Estimated Time: 4-8 h
Download the files needed for the sections below, here: https://wiki.zentyal.org/files/Zentyal%204.0%20Monitoring%20with%20Zabbix.tar.gz
Installing Zabbix Server
Operating System
We are suggesting the installation on a different host or virtual machine than Zentyal itself., as monitoring can be a pretty resource intensive service (although not that heavy if we are to monitor just a few hosts).
We are going to perform the installation on the same base distribution that Zentyal 4.0 uses: Ubuntu Server 14.04 . Download the ISO from and install the operating system http://www.ubuntu.com/download/server .
Zabbix package
We are installing Zabbix 2.2 . We'll follow instructions at https://www.zabbix.com/documentation/2.2/manual/installation#installing_repository_configuration_package1 .
First, we configure the Zabbix APT repository and update the list of packages:
# wget http://repo.zabbix.com/zabbix/2.2/ubuntu/pool/main/z/zabbix-release/zabbix-release_2.2-1+trusty_all.deb
# dpkg -i zabbix-release_2.2-1+trusty_all.deb
# apt-get update
Then we install the packages we need:
# apt-get install zabbix-server-mysql zabbix-frontend-php
This process may ask us for a password for the database root. Enter a password.
Next screen will ask us if we want to use dbconfig-common for database configuration, and a password for the zabbix database user. We will also be asked for the database root password you entered in the previous step.
PHP Timezone
Zabbix requires that PHP Timezone is configured. Edit the file /etc/php5/apache2/php.ini and find the line that contains 'date.timezone'. Set it as follows:
; Defines the default timezone used by the date functions
; http://php.net/date.timezone
date.timezone = Europe/Madrid
You can use any of the supported timezones, listed at http://php.net/manual/en/timezones.php .
Setup (via web interface)
Once the previous step is finished, we can access Zabbix trough the web interface.
Enter the IP address of the Zabbix Server in your browser, and get /zabbix (replace the IP address or hostname in the following URL):
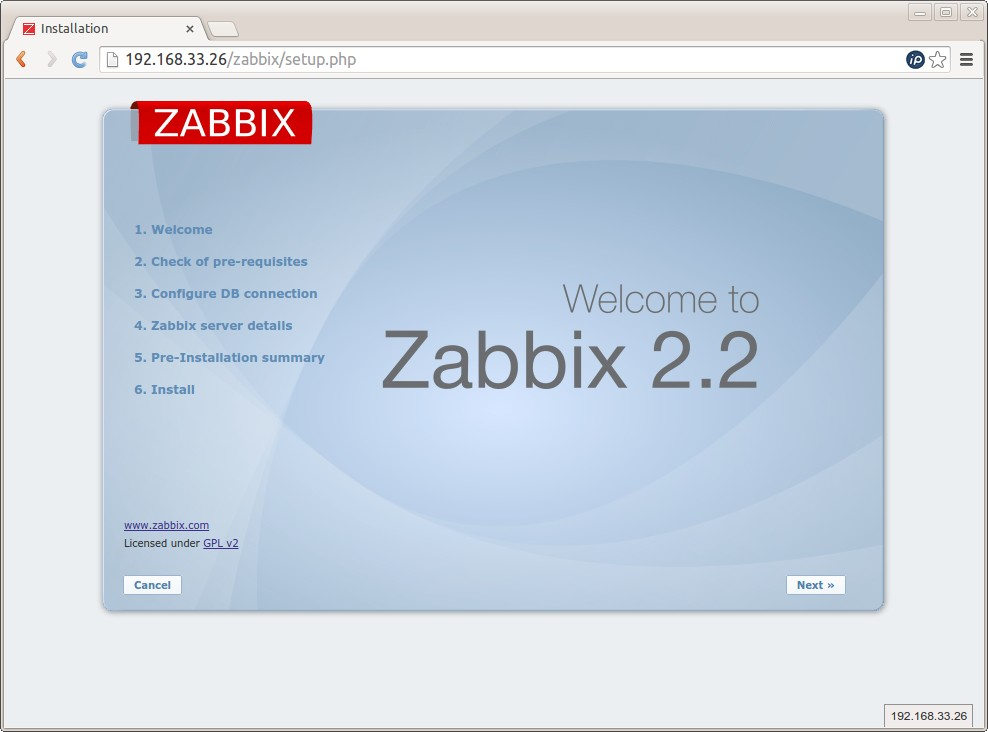
You will be redirected to shown Zabbix setup screen. Click Next.
On step 2 the wizard will check that all prerequisites are satisfied. Click Next.
On step 3, enter the database credentials for the Zabbix application, using the password you entered during package installation. Click Next.
On step 4 you can accept defaults. Click Next.
Click Next for the last two steps.
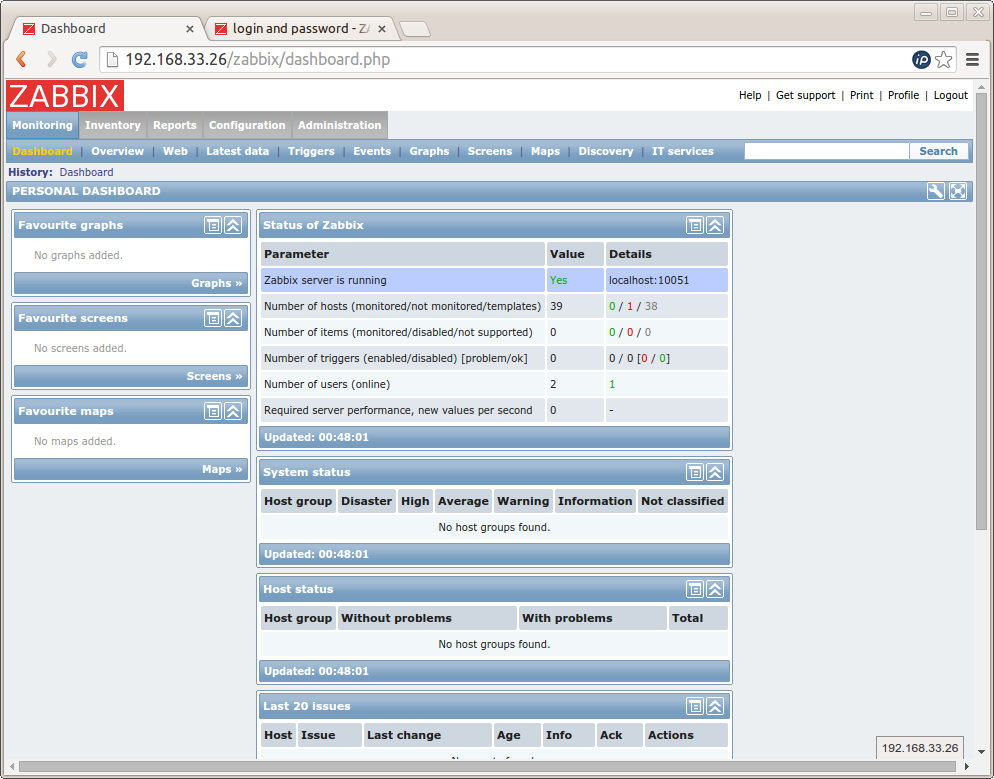
After the process finishes, you will be now redirected to the Zabbix login screen. Default username and password are “admin/zabbix”. Once you've logged in, you shall see the Dashboard.
The next step is to install and configure Zabbix agent in Zentyal so it can be monitored.
Installing Zabbix Agent (Client) on Zentyal
We need to install Zabbix agent from the zabbix package repository. On the Zentyal host to be monitored, in the directory /etc/apt/sources.list.d, create a file named zabbix-repo.list (the .list extension is necessary), with the following content:
# zabbix_repo
deb http://repo.zabbix.com/zabbix/2.2/ubuntu trusty main
deb-src http://repo.zabbix.com/zabbix/2.2/ubuntu trusty main
Update the APT repository and install Zabbix Agent using:
sudo apt-get update
sudo apt-get install zabbix-agent zabbix-sender
Ensure that a directory for the log files exists (not doing this may prevent the zabbix-agent service from starting):
sudo mkdir /var/log/zabbix-agent/
chown zabbix. /var/log/zabbix-agent
Configuring Zabbix agent
Next, let's configure Zabbix agent. Edit /etc/zabbix/zabbix_agentd.conf. Find the following entries:
1) Edit the Server config parameter and specify the IP of your Zabbix server (use an IP that is visible from the server). Specify the ServerActive parameter too (you may need to add it if it's not already present in the file).
Server=1.2.3.4
ServerActive=1.2.3.4
2) Optionally, specify the Hostname parameter. Using the server FQDN name is recommended here. This name must match the hostname that will be configured on the Zabbix Server later on.
3) The rest of the configuration allows monitoring of extra server parameters which are not available by default. In order to add this, copy the enclosed files from this article (files/zabbix- agent/etc-zabbix) to your /etc/zabbix directory, including the zabbix_agentd.d content.
The list of files to be added to /etc/zabbix is:
- zabbix-apache-updater.py
- zabbix-postfix-updater.sh
The list of files to be copied to /etc/zabbix/zabbix_agentd.d is:
- timeout.conf
- userparameter_apt.conf
- userparameter_mysql.conf
- userparameter_ntp.conf
- userparameter_postfix.conf
- userparameter_sockstat.conf
4) Ensure that the custom monitoring scripts in /etc/zabbix have executable permissions:
sudo chmod u+x /etc/zabbix/zabbix-*-updater.*
5) Copy scheduler configuration files from the enclosed files (files/zabbix-agent/etc-cron.d) to /etc/cron.d/
6) Restart zabbix agent:
sudo service zabbix-agent restart
Configuring Zentyal firewall
In order for the Zabbix server to be able to contact your Zabbix agent, you may need to configure Zentyal Firewall in order to allow connections coming from the monitoring server.
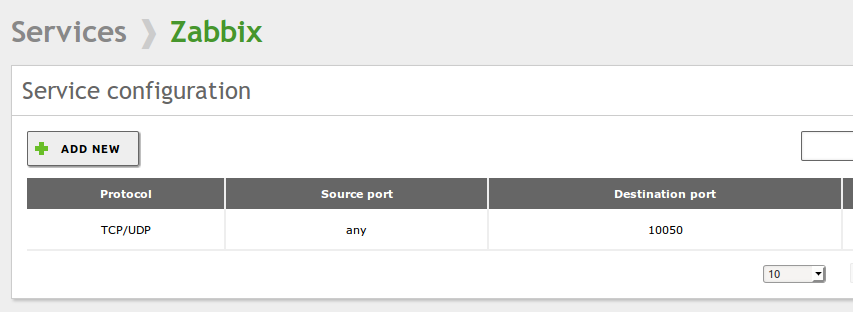
Using Zentyal administration web interface, let's define a service for the zabbix protocol. Go to Network > Services and click on Add New. Enter “Zabbix” for the name and accept. Then configure the service to match TCP/UDP packets with destination port 10050 as shown in the following picture:
Once the service is defined, you can configure your Zentyal firewall. Depending on whether you will be monitoring Zentyal from an external or an internal interface, you will need to use the corresponding section of the Zentyal firewall configuration interface:
- Use “Filtering Rules from external networks to Zentyal” if you are monitoring through an external interface
- Filtering Rules from internal networks to Zentyal (if you are monitoring from an internal interface).
Configure a rule to accept Zabbix traffic like in the following screenshot:
Now that the client side has been configured, we can carry on and configure monitoring for our host.
Configuring Zabbix
Adding the host
Login to the Zabbix server through the web interface.
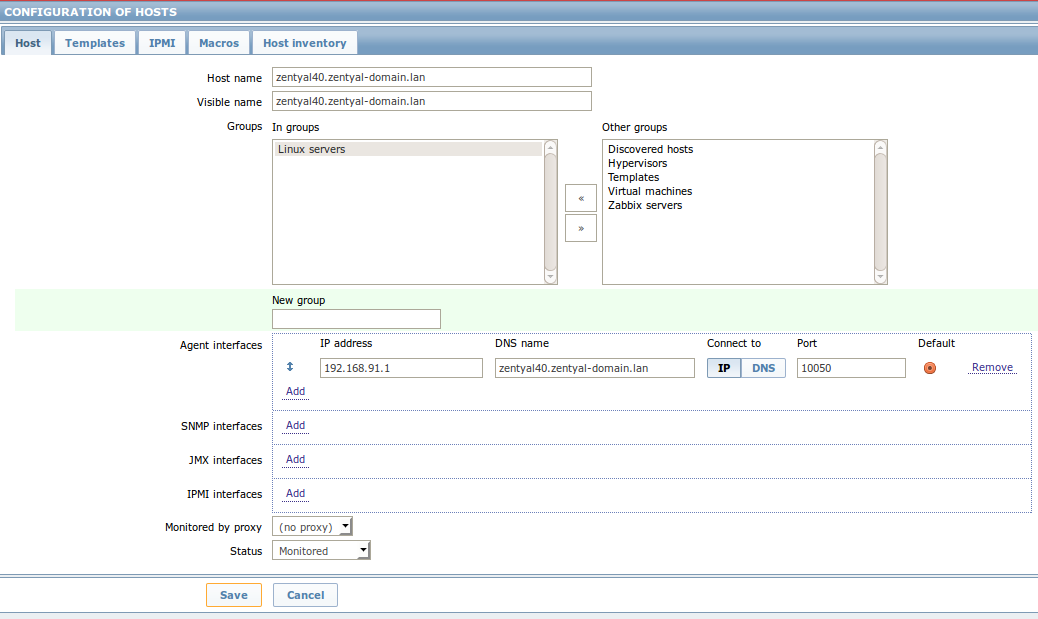
Go to Configuration > Hosts. Here we can add the new host to be monitored (our Zentyal 4.0 host). Click on Create Host.
Fill in the host data as shown above. Make sure that you enter the IP address and DNS name, and then correctly select the “IP” or “DNS” (use IP unless you are certain that the DNS name can be correctly resolved from the Zabbix server). Ensure you select the group “Linux Servers”. Click Save.
We now need to configure the different set of services to be monitored.
Default monitoring (Linux template, NTP, Network, Disks...)
We'll firstly configure default Zabbix services that can be applied to most Linux hosts.
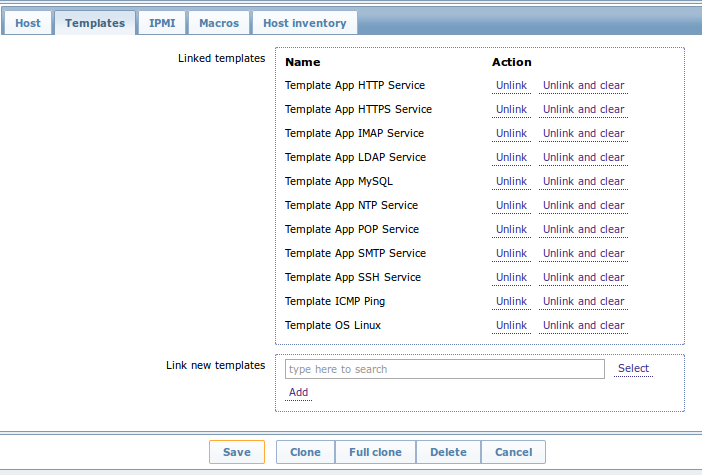
Go to Configuration > Hosts. Select the Zentyal host and click on the Templates tab. Select the templates shown in the picture below and make sure you click Add. Then click Save.
Note that some templates may conflict with others. Ensure you select only the ones listed below.
Click Save and then go back to the list of hosts (Configuration > Hosts). You should see the recently added host and the monitoring status should be green (signalling that the host is being monitored).
If connection is failing (red icon) move the mouse over the red icon and check the tooltip. It will indicate the error (usually a connection error). If so, ensure that connectivity is guaranteed (review firewall, zabbix agent configuration and host configuration in Zabbix web interface):
Testing
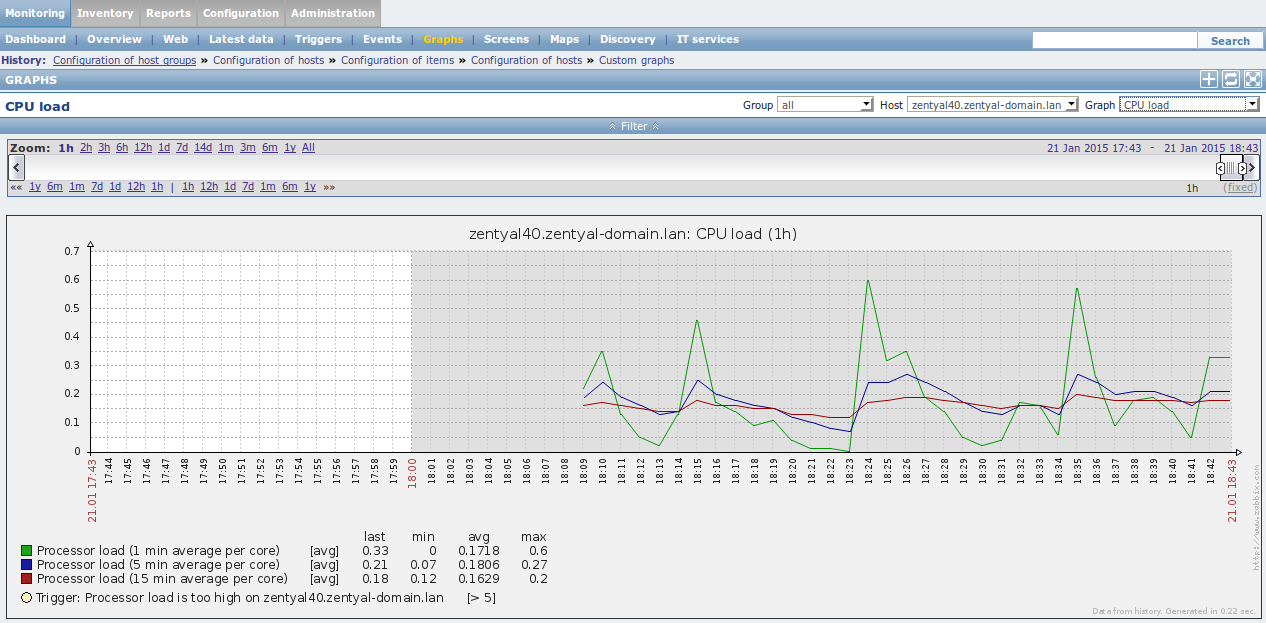
At this point, you can observe data through the Monitoring > Graphs menu. Select the host and graphic from the options at the right of the menu bar.
Observe that some triggers have also been configured with sensible defaults for most metrics. You can check the dashboard if a metric falls beyond the trigger limit. You can also enable alerts in various ways get an immediate report when this happens (check Zabbix documentation for further information about alerts).
Zentyal specific configuration
Package monitoring (critical updates)
This will allow us to monitor information about pending package upgrades (for both regular and critical package updates) of the Zentyal software and base Ubuntu operating system.
Import the enclosed Zabbix template (zabbix-templates/zbx_apt.xml). In order to do this, got o Configuration > Templates and click on the Import button. Select the aforementioned file and click Import.
Once you have done this, go to Configuration > Hosts and click on the monitored Zentyal host. Go to the Templates tab and add the new template (in this case, called APT Packages).
TCP/UDP stats
Following the same process as for Package Monitoring template above, import and apply the “TCP/UDP” template (zabbix-templates/zbx_tcpudp.xml) to the monitored host.
This template also adds a graph to visually monitor the state of TCP/UDP connections.
MTA Monitoring (Postfix)
Postfix is Zentyal MTA (Mail Transport Agent). It is usually interesting to keep an eye on the mail queue as well as some other metrics.
Following the same process as for Package Monitoring template above, import and apply the “Template_App_Postfix” (zabbix-templates/zbx_postfix.xml) template to the monitored host.
This template will also add two comprehensive graphs for better mail transport analysis.
Samba monitoring
Following the same process as for Package Monitoring template above, import and apply the “Template_App_Samba” (zabbix-templates/zbx_samba.xml) template to the monitored host.
This template includes triggers that signal when any of the monitored services is down.
OpenChange monitoring
Following the same process as for Package Monitoring template above, import and apply the “Template_App_Openchange” (zabbix-templates/zbx_openchange.xml) template to the monitored host.
This template includes triggers that signal when any of the monitored services is down.
More Zabbix documentation
Zabbix is a complex monitorization software with many other features not mentioned in this document. Please refer to the full documentation:
https://www.zabbix.com/documentation/2.2/manual
Other considerations
Use this white paper at your own discretion. Note that Zentyal and Zentyal Support do not support Zabbix directly.
This white paper does not cover information about how to configure other metrics like hardware status (temperatures, fan speeds), specific storage metrics (like SMART or RAIDs), and several other metrics that may be of interest. All these can be set up with Zabbix, please refer to Zabbix documentation and Zabbix community for further information about these topics.
There are several approaches to Zabbix configuration, regarding how the link betweeen Templates, Host Groups and Hosts is managed. The instructions in this document serve as a reference, but youmay prefer to alter your configuration strategy slightly to better suit your needs. In all cases, the provided templates and scripts still apply.
